TracePlot 2.3 x64 x86
TracePlot is a tool intended for the use of professionals, and student, involved with the testing of radio and satellite communications systems.
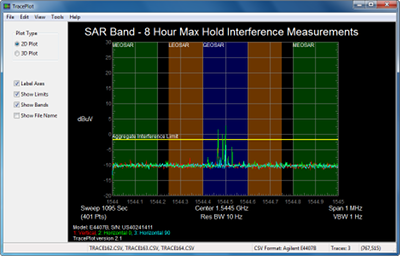
TracePlot is an easy to use tool to display diagrams from spectrum analyser CSV trace files.
Modern spectrum analyzers and other electrical test equipment usually include a way to save the measurement data to a computer file for later processing. In older units this may simply be an image file showing the screen image from the device. However, most modern units also allow saving the actual measurement data to a CSV (comma separated values) file.
For a single CSV trace file, or a small number of files, it is quite easy to load them into a spreadsheet program and generate simple charts.
TracePlot was created for measurement projects where many CSV files of similar format are being generated, and where multiple separate trace files need to be displayed on a single chart. TracePlot allows the user to load multiple trace files and display the data all together on the one chart, in either 2D or 3D format. TracePlot allows the user to control colours and fonts, and view angles for the 3D plots, to add limit lines and labels, and colour shaded frequency bands. TracePlot then allows the user to save all of this configuration into a settings file (*.traceset). Users may then quickly produce consistent charts with the same settings for large numbers of CSV trace files.
9MB
http://s15.alxa.net/001/03/TracePlot.2.3.rar
TracePlot is a tool intended for the use of professionals, and student, involved with the testing of radio and satellite communications systems.
TracePlot is an easy to use tool to display diagrams from spectrum analyser CSV trace files.
Modern spectrum analyzers and other electrical test equipment usually include a way to save the measurement data to a computer file for later processing. In older units this may simply be an image file showing the screen image from the device. However, most modern units also allow saving the actual measurement data to a CSV (comma separated values) file.
For a single CSV trace file, or a small number of files, it is quite easy to load them into a spreadsheet program and generate simple charts.
TracePlot was created for measurement projects where many CSV files of similar format are being generated, and where multiple separate trace files need to be displayed on a single chart. TracePlot allows the user to load multiple trace files and display the data all together on the one chart, in either 2D or 3D format. TracePlot allows the user to control colours and fonts, and view angles for the 3D plots, to add limit lines and labels, and colour shaded frequency bands. TracePlot then allows the user to save all of this configuration into a settings file (*.traceset). Users may then quickly produce consistent charts with the same settings for large numbers of CSV trace files.
9MB
http://s15.alxa.net/001/03/TracePlot.2.3.rar