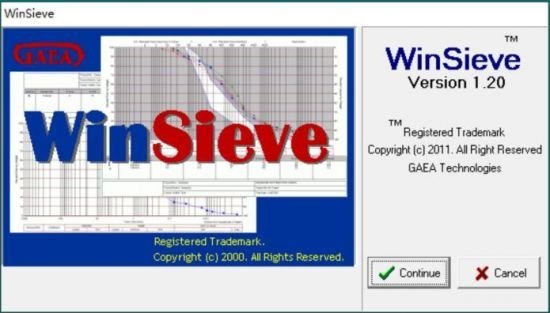
GAEA Winsieve 1.20
WinSieve is a software company from GAEA Technologies in the field of geology that specializes in engineering fine grains, their classification and sedimentological information. With this program you can edit and print analytical charts on particle size in several design standards and formats. The particle size analysis test can include screening data, sedimentology, and hydrometric grading tests based on the ASTM D-422 method.

In WinSieve, each chart is divided into three sections: chart, chart guide – optional, and title. The result of granulation analysis will result in up to 5 experiments plotting on a graph. In addition, the grading characteristics can be inserted on the graph. Below each chart a classification system is drawn to allow easy comparison with sample results. Various classification systems are supported in this program, including:
USCS
USDA
AASHTO
International
BS 5930
Modified Wentworth Australian
Detailed Modified Wentworth
Australian
Additionally, WinSieve includes an optional guide section at the top and bottom of the chart that can include sample information, classification results and granularity analysis. There is a header or title at the top or bottom of each chart that can be used to display a company logo, site map, project name, sample information and other similar text.
FEATURES
Store data of each project in Access database
Supports popular grading standards with the ability to increase them
Ability to define custom time for hydrometric testing
Ability to plot up to 5-grain tests per graph
Ability to place similar aggregation specifications on different charts
Automatic calculation of the percentage of soil components
Automatic calculation of data classification, D10, D30, D60, Cu and Cc
Automatic calculation of mean, skewness, the elasticity of statistical data and their sorting
Usability of classification systems (Unified, USDA, Modified Wentworth, AASHTO, International, Australian) and selection of templates to apply to all screening analytical tests.
Easily customize scales, line styles, dot tagging, titles and layouts and guides, headers and more.
Comparison of specifications and test results
40.3MB
*
WinSieve is a software company from GAEA Technologies in the field of geology that specializes in engineering fine grains, their classification and sedimentological information. With this program you can edit and print analytical charts on particle size in several design standards and formats. The particle size analysis test can include screening data, sedimentology, and hydrometric grading tests based on the ASTM D-422 method.

In WinSieve, each chart is divided into three sections: chart, chart guide – optional, and title. The result of granulation analysis will result in up to 5 experiments plotting on a graph. In addition, the grading characteristics can be inserted on the graph. Below each chart a classification system is drawn to allow easy comparison with sample results. Various classification systems are supported in this program, including:
USCS
USDA
AASHTO
International
BS 5930
Modified Wentworth Australian
Detailed Modified Wentworth
Australian
Additionally, WinSieve includes an optional guide section at the top and bottom of the chart that can include sample information, classification results and granularity analysis. There is a header or title at the top or bottom of each chart that can be used to display a company logo, site map, project name, sample information and other similar text.
FEATURES
Store data of each project in Access database
Supports popular grading standards with the ability to increase them
Ability to define custom time for hydrometric testing
Ability to plot up to 5-grain tests per graph
Ability to place similar aggregation specifications on different charts
Automatic calculation of the percentage of soil components
Automatic calculation of data classification, D10, D30, D60, Cu and Cc
Automatic calculation of mean, skewness, the elasticity of statistical data and their sorting
Usability of classification systems (Unified, USDA, Modified Wentworth, AASHTO, International, Australian) and selection of templates to apply to all screening analytical tests.
Easily customize scales, line styles, dot tagging, titles and layouts and guides, headers and more.
Comparison of specifications and test results
40.3MB
*