Rainbow Analyst add-in Professional 25.01.0
Rainbow Analyst (so named for its uniquely powerful use of colour-coding) combines several areas of world-class spreadsheet auditing functionality.
- Excel™ spreadsheet audit and analysis tools with formula grouping and >50 analysis options.
- Spreadsheet comparison tools to track differences in cell formulas, macro code and other content.
- A unique set of spreadsheet clean-up tools which can even repair Excel’s underlying XML files.
- An audit sampling tool with three different methods of sample selection and a sample size calculator.
Summary Report
This is the place to start when you want an overview of a workbook you haven’t seen before.
It is always worth generating a Summary Report before looking at a spreadsheet in detail. It lists information about the Excel file (pink section), the workbook as a whole (green section), and each sheet in the workbook (blue section).
The report is quick to produce, and as well as giving an overall quality rating for the spreadsheet, it can indicate unexpected issues such as Visual Basic code, hidden sheets or hard-coding in formulas. Issues which have impacted the overall quality rating will be highlighted in yellow (somewhat significant) or red (very significant).
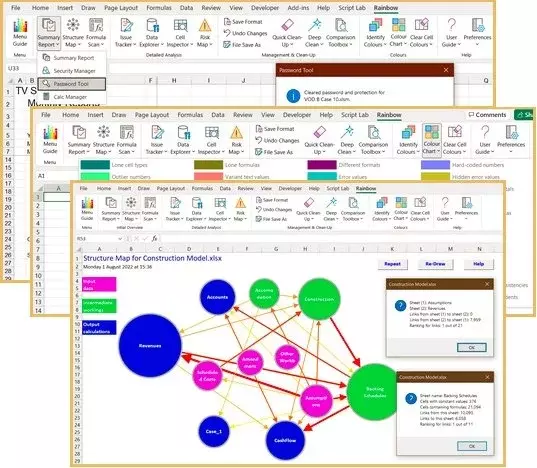
Password Tool
When you need to unprotect a worksheet and the password has been lost, this tool has the answer.
Most Excel users will have come across a situation where they needed to unprotect an old spreadsheet where the sheets and/or the workbook structure were protected with a password, and nobody could remember the correct password. Rainbow’s Password Tool can help in this situation, enabling you to remove protection by deleting sheet or workbook passwords.
Note that this tool will not unlock workbooks which require a password to open; these are encrypted and cannot be opened without knowing the password (or attempting to crack it with a “brute force attack”).
Structure Map
This neat diagram includes multiple levels of information and gives you an immediate sense of the overall structure of a workbook.
Although tabular reports (like the Summary Report) can display a large amount of information, it is not always easy to make sense of them. And so the Structure Map perfectly complements the Summary Report, giving you an immediately intelligible diagram of the structure of a workbook, showing all the sheets in the workbook as circles (nodes), linked by arrows (connectors) representing the logic flows between sheets.
The size of each circle in the diagram is an approximate indication of the size of (number of cells in) the sheet, and the circles are colour-coded to show whether a sheet contains mainly input data (purple), intermediate workings (green), or output calculations (blue). Similarly the arrows are colour-coded to indicate whether the flow of logic (number of links) between the sheets is small (yellow), medium (orange), or large (red). And you can simply click on any circle or any arrow to see detailed information such as the exact numbers of inter-sheet links.
Formula Scan
The Formula Scan function gives you a detailed report listing each unique formula, with a note of any potential issues that Rainbow has found.
And on the worksheet itself, each block of formulas is highlighted so that you can instantly spot inconsistencies.
The Formula Scan function analyses row and column differences to identify groups of copied formulas, and it then uses Rainbow’s unique set of colours to highlight each group. This lets you see at a glance where there are inconsistent formulas in a row or column (which may indicate an error), and it allows you to check just one cell in a group and know that all the other cells have the same formula.
In addition, Formula Scan can run a battery of tests on the first formula in each group, listing any detected problems in a report, and it can flag some or all formulas so that progress on auditing them and resolving issues can be tracked with the Issue Tracker function.
Initial Overview functions
The Summary Report, Password Tool, Structure Map, and Formula Scan functions (explained above) are all to be found in the Initial Overview group on the Rainbow menu. The Password Tool is on the drop-down under Summary Report.
Also on the drop-down under Summary Report is the Security Manager function, which can hide or unhide and protect or unprotect selected worksheets, and Calc Manager which lets you control the calculation and recalculation of ranges and worksheets as well as all open workbooks.
Under Structure Map, the Inter-Sheet Logic function generates a tabular matrix that shows you the flow of logic between sheets in your workbook, and Data Links helps you track down where your spreadsheet calculations are linked to individual cells in another workbook.
Under Formula Scan, Logic Map gives you a visual picture that helps you quickly grasp the flow of calculation from inputs through workings to final results, and Logic Colours provides a key to the colours used in the Logic Map and lets you search for them in the worksheet.
File size: 3.8 MB
Download
*
Rainbow Analyst (so named for its uniquely powerful use of colour-coding) combines several areas of world-class spreadsheet auditing functionality.
- Excel™ spreadsheet audit and analysis tools with formula grouping and >50 analysis options.
- Spreadsheet comparison tools to track differences in cell formulas, macro code and other content.
- A unique set of spreadsheet clean-up tools which can even repair Excel’s underlying XML files.
- An audit sampling tool with three different methods of sample selection and a sample size calculator.
Summary Report
This is the place to start when you want an overview of a workbook you haven’t seen before.
It is always worth generating a Summary Report before looking at a spreadsheet in detail. It lists information about the Excel file (pink section), the workbook as a whole (green section), and each sheet in the workbook (blue section).
The report is quick to produce, and as well as giving an overall quality rating for the spreadsheet, it can indicate unexpected issues such as Visual Basic code, hidden sheets or hard-coding in formulas. Issues which have impacted the overall quality rating will be highlighted in yellow (somewhat significant) or red (very significant).
Password Tool
When you need to unprotect a worksheet and the password has been lost, this tool has the answer.
Most Excel users will have come across a situation where they needed to unprotect an old spreadsheet where the sheets and/or the workbook structure were protected with a password, and nobody could remember the correct password. Rainbow’s Password Tool can help in this situation, enabling you to remove protection by deleting sheet or workbook passwords.
Note that this tool will not unlock workbooks which require a password to open; these are encrypted and cannot be opened without knowing the password (or attempting to crack it with a “brute force attack”).
Structure Map
This neat diagram includes multiple levels of information and gives you an immediate sense of the overall structure of a workbook.
Although tabular reports (like the Summary Report) can display a large amount of information, it is not always easy to make sense of them. And so the Structure Map perfectly complements the Summary Report, giving you an immediately intelligible diagram of the structure of a workbook, showing all the sheets in the workbook as circles (nodes), linked by arrows (connectors) representing the logic flows between sheets.
The size of each circle in the diagram is an approximate indication of the size of (number of cells in) the sheet, and the circles are colour-coded to show whether a sheet contains mainly input data (purple), intermediate workings (green), or output calculations (blue). Similarly the arrows are colour-coded to indicate whether the flow of logic (number of links) between the sheets is small (yellow), medium (orange), or large (red). And you can simply click on any circle or any arrow to see detailed information such as the exact numbers of inter-sheet links.
Formula Scan
The Formula Scan function gives you a detailed report listing each unique formula, with a note of any potential issues that Rainbow has found.
And on the worksheet itself, each block of formulas is highlighted so that you can instantly spot inconsistencies.
The Formula Scan function analyses row and column differences to identify groups of copied formulas, and it then uses Rainbow’s unique set of colours to highlight each group. This lets you see at a glance where there are inconsistent formulas in a row or column (which may indicate an error), and it allows you to check just one cell in a group and know that all the other cells have the same formula.
In addition, Formula Scan can run a battery of tests on the first formula in each group, listing any detected problems in a report, and it can flag some or all formulas so that progress on auditing them and resolving issues can be tracked with the Issue Tracker function.
Initial Overview functions
The Summary Report, Password Tool, Structure Map, and Formula Scan functions (explained above) are all to be found in the Initial Overview group on the Rainbow menu. The Password Tool is on the drop-down under Summary Report.
Also on the drop-down under Summary Report is the Security Manager function, which can hide or unhide and protect or unprotect selected worksheets, and Calc Manager which lets you control the calculation and recalculation of ranges and worksheets as well as all open workbooks.
Under Structure Map, the Inter-Sheet Logic function generates a tabular matrix that shows you the flow of logic between sheets in your workbook, and Data Links helps you track down where your spreadsheet calculations are linked to individual cells in another workbook.
Under Formula Scan, Logic Map gives you a visual picture that helps you quickly grasp the flow of calculation from inputs through workings to final results, and Logic Colours provides a key to the colours used in the Logic Map and lets you search for them in the worksheet.
File size: 3.8 MB
Download
*