R Programming Application In Data Visualization And Gis
R PROGRAMMING APPLICATION IN DATA VISUALIZATION AND GIS
What you'll learn
This course is designed for statistical computing, data visualization and GIS. Students use it for Elementary Data Analysis, and data mining to graphing.
R is an advanced free programming language that performs various complex statistical analyses and modelling.
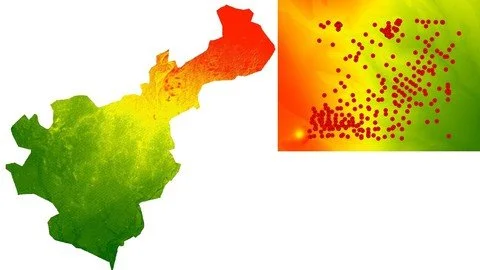
R in GIS is growing because of its enhanced capabilities for data visualization and you will do practice on real data set.
You will learn about the extensive libraries for to generate high-quality graphs and visuals.
Requirements
Laptop or PC with 4GB RAM, System with internet connection, Dedication to learn.
Description
Analysing data requires a lot of research. But do you know anything that can make it easier? R is used to create projects and models. These projects are dependent on data. Researchers use this programming language to create business models and perform data analysis functions. This course benefits research scholars and those who want to be data scientists. R has been around since 1995, becoming the most popular programming language among data scientists worldwide. This course includes several data packages and functions, making it an attractive programming language for data scientists. R gives an excellent platform for data analysis, data wrangling, data visualisation, machine learning and open source.
This course covers traditional statistics to advance statistics and GIS applications, such as models, graph descriptive statistics, mathematical trend modelling and spatial plots. R is designed to be a tool that helps scientists analyse data, and It has many excellent functions that make plots and fit models to data. Because of this, many statisticians learn to use R as if it were a piece of software; they discover which functions accomplish what they need and ignore the rest. This course has been divided into two measures part: the first part is the data visualisation, and the second part is the GIS in R. The course has been done on the actual data set.
Overview
Section 1: Introduction
Lecture 1 Introduction
Section 2: How to install R, RStudio and Descriptive statistics
Lecture 2 R, RStudio Installation, Directory Path and Descriptive Statistics
Section 3: Data Visualization by Box Plot
Lecture 3 Data visualization through different box plot
Section 4: Data visualization through different bar plot
Lecture 4 Data visualization through different bar plot
Section 5: Data visualization through histogram plot
Lecture 5 Data visualization through histogram plot
Section 6: Data visualization through regression analyses and QQ plot
Lecture 6 Data visualization through regression analyses and QQ plot
Section 7: Shape file import, export and shapefile fetching of any region
Lecture 7 Shape file import, export and shapefile fetching of any region
Section 8: Clip and Crop
Lecture 8 Clip and Crop
Section 9: Raster Image Stacking
Lecture 9 Raster Image Stacking
Section 10: Level plot
Lecture 10 Level plot
Section 11: Raster to contour
Lecture 11 Raster to contour
Research Scholar and those who want to become carrier in the field of data scientist.
Published 10/2023
MP4 | Video: h264, 1920x1080 | Audio: AAC, 44.1 KHz
Language: English | Size: 1.25 GB | Duration: 1h 37m
Download
*
R PROGRAMMING APPLICATION IN DATA VISUALIZATION AND GIS
What you'll learn
This course is designed for statistical computing, data visualization and GIS. Students use it for Elementary Data Analysis, and data mining to graphing.
R is an advanced free programming language that performs various complex statistical analyses and modelling.
R in GIS is growing because of its enhanced capabilities for data visualization and you will do practice on real data set.
You will learn about the extensive libraries for to generate high-quality graphs and visuals.
Requirements
Laptop or PC with 4GB RAM, System with internet connection, Dedication to learn.
Description
Analysing data requires a lot of research. But do you know anything that can make it easier? R is used to create projects and models. These projects are dependent on data. Researchers use this programming language to create business models and perform data analysis functions. This course benefits research scholars and those who want to be data scientists. R has been around since 1995, becoming the most popular programming language among data scientists worldwide. This course includes several data packages and functions, making it an attractive programming language for data scientists. R gives an excellent platform for data analysis, data wrangling, data visualisation, machine learning and open source.
This course covers traditional statistics to advance statistics and GIS applications, such as models, graph descriptive statistics, mathematical trend modelling and spatial plots. R is designed to be a tool that helps scientists analyse data, and It has many excellent functions that make plots and fit models to data. Because of this, many statisticians learn to use R as if it were a piece of software; they discover which functions accomplish what they need and ignore the rest. This course has been divided into two measures part: the first part is the data visualisation, and the second part is the GIS in R. The course has been done on the actual data set.
Overview
Section 1: Introduction
Lecture 1 Introduction
Section 2: How to install R, RStudio and Descriptive statistics
Lecture 2 R, RStudio Installation, Directory Path and Descriptive Statistics
Section 3: Data Visualization by Box Plot
Lecture 3 Data visualization through different box plot
Section 4: Data visualization through different bar plot
Lecture 4 Data visualization through different bar plot
Section 5: Data visualization through histogram plot
Lecture 5 Data visualization through histogram plot
Section 6: Data visualization through regression analyses and QQ plot
Lecture 6 Data visualization through regression analyses and QQ plot
Section 7: Shape file import, export and shapefile fetching of any region
Lecture 7 Shape file import, export and shapefile fetching of any region
Section 8: Clip and Crop
Lecture 8 Clip and Crop
Section 9: Raster Image Stacking
Lecture 9 Raster Image Stacking
Section 10: Level plot
Lecture 10 Level plot
Section 11: Raster to contour
Lecture 11 Raster to contour
Research Scholar and those who want to become carrier in the field of data scientist.
Published 10/2023
MP4 | Video: h264, 1920x1080 | Audio: AAC, 44.1 KHz
Language: English | Size: 1.25 GB | Duration: 1h 37m
Download
*